If you are confident with your A-C compressor it means then it is operating at an optimal capacity. But of course, it operates as an element in refrigeration so it might develop some malfunction over time.
If you are to deal with such an issue on your own and in a safe fashion then you need to understand how to interpret the reading provided by the A-C compressor unit.
You can always hire an A-C pro help if you don’t know how to read it. But the serviceman you are hiring needs to have the expertise to identify the problem within the compressor unit.
In this article, we are going to find everything about what an R134a chart is and how it works.
What is the meaning of R134a?
R134a is a type of refrigerant and it is quite commonly used in a range of different homes as well as industrial appliances. All these appliances come with a refrigeration unit fitted to them and it is called a compressor.
Within the compressor, these appliances have R134a refrigerant or coolant. This refrigerant allows the compressor to effectively perform all its designated functions.
Now, when you add a gauge or a meter to understand the current operational status of this compressor you will have to deal with different readings, and for that, you will need your R 134a chart.
How Does the R134a Pressure Chart Help?
The gauge displays different pressure readings during operation and to interpret those readings against temperature, you will need a pressure chart, or an R134 pressure chart to be precise.
This pressure chart has three different columns within a table and it has all the readings on it. The three columns are titled high side pressure columns, low side pressure columns, and temperature columns.
Usually, it is called an AC pressure chart but because we are talking about the 134a refrigerant, therefore, we will address it as an R134a pressures chart. This chart provides us with the relation between temperature and pressure of the 134a refrigerant.
Different Components of R134a Pressure Charts
| Ambient Temperature | Low Side Pressure | High Side Pressure |
| 110℉ | 50 → 55 PSI | 335 → 345 PSI |
| 105℉ | 50 → 55 PSI | 325 → 335 PSI |
| 100℉ | 50 → 55 PSI | 300 → 325 PSI |
| 95℉ | 50 → 55 PSI | 275 → 300 PSI |
| 90℉ | 50 → 55 PSI | 250 → 275 PSI |
| 85℉ | 50 → 55 PSI | 220 → 250 PSI |
| 80℉ | 45 → 50 PSI | 175 → 220 PSI |
| 75℉ | 40 → 45 PSI | 150 → 175 PSI |
| 70℉ | 35 → 40 PSI | 140 → 165 PSI |
| 65℉ | 25 → 35 PSI | 135 → 155 PSI |
Primarily there are two components of the R 134a pressure temperature chart: one is temperature and the other is pressure. But there are two different columns of pressure readings. One of them is high side pressure and the other one is low side pressure.
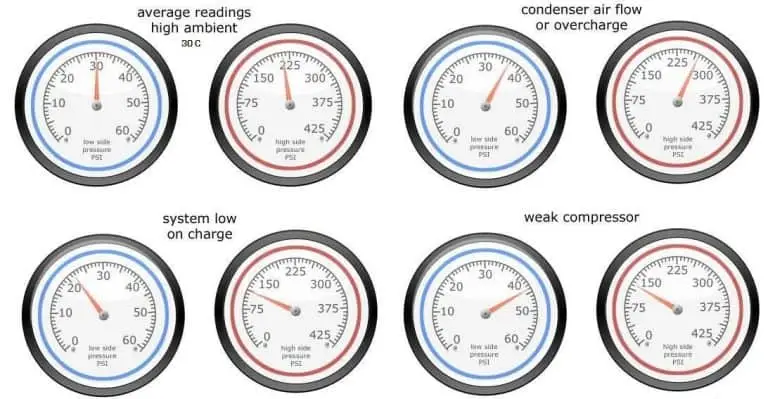
The gauge that is there on the refrigeration component also features two meters. One of the meters shows high-pressure readings while the other one shows low-pressure readings.
This pressure chart for R 134a details the relationship between pressure and temperature. So is it really important? Yes, you can use this chart to find out whether your A-C compressor is in the need of a refrigerant recharge or not.
These readings can also tell you whether the compressor is working at its best or not. But finding out these readings is a pretty hectic and time-consuming job and this is where the pressure chart comes in. but even using this chart is not a walk in the park and for the best results you have to measure it against the readings of pressure.
In other words, you have to understand what each of these readings stands for. To properly interpret the reading you will have to read both sides of the gauges and the table. But to ease things down a bit, it is more important that you focus on the low-pressure gauge and compare it with temperature readings.
Reading the low side of the pressure-temperature chart
The rule of thumb is that a compressor that is performing well gives off low numbers on the low-pressure gauge. It means that the compressor doesn’t need any cleaning and it is also getting proper airflow. It will allow you to read and interpret the pressure-temperature chart more effectively.
This is a no-brainer because only a good compressor can keep working at low pressure even in high temperatures. But it also indicated two other things.
- The A-C compressor unit is currently not engaged and hence there is altering displacement in the compressor’s operation.
- Or the operation of your compressor is failing and you have to replace it.
On the other hand, if the low side pressure is high on the chart, it means,
- You need to look at the condenser fan and see that it is working properly or not. There might be some dirt that is clogging it which causes obstruction in the air.
- The flow of refrigerant might also obstruct the compressor.
When the system pressure is low on the low side of the chart and the temperature is high, it means that the overall system is not functioning at an optimal level.
Apart from that, when you see that the pressure-temperature chart is indicating almost equal system pressure on both sides then,
- The displacement function of the AC compressor might not be working and you have to check it.
- There is an expansion valve in the air conditioning and it may not be working. In simple words, your A-C compressor might be failing.
Normal Operating Pressures For R 134a Refrigerant
The pressure gauges for this refrigerant stays between 22 PSI and 57 PSI (pounds per square inch). But you have to keep in mind that there are two different sides to this chart. And you have to consider the low as well as the high side.
Hence, the normal low-pressure side for R 134a needs to be less than 90 degrees. Plus, the PSI should be right around 30.
Why is Low Side Pressure High?
Going through the entire text above, you will come to know that low side high pressure on the chart is not a good sign. It is because the A-C compressor system of your car might be failing and you have to service it.
When having a closer look, your technician might end up noting one or all of the following situations,
- The technician might determine that the condenser fan is not running because of the clogged dirt. It is causing an obstruction in the airflow.
- Or there is a chance that the technician might find out that the refrigerant is not flowing properly either.
Final Word
A pressure-temperature chart is a useful tool for every car A-C system or appliance technician. It is equally important for a home inspection and commercial interpretation.
This table assists in scrutinizing, identifying, and resolving several problems that might arise due to refrigerants within different systems. Therefore, if you are a car or appliance technician you will need to have this chart in your kit at all times. You can also watch this video for further assistance.

The information was very useful for me